Postingan

Menampilkan postingan dari Februari, 2019

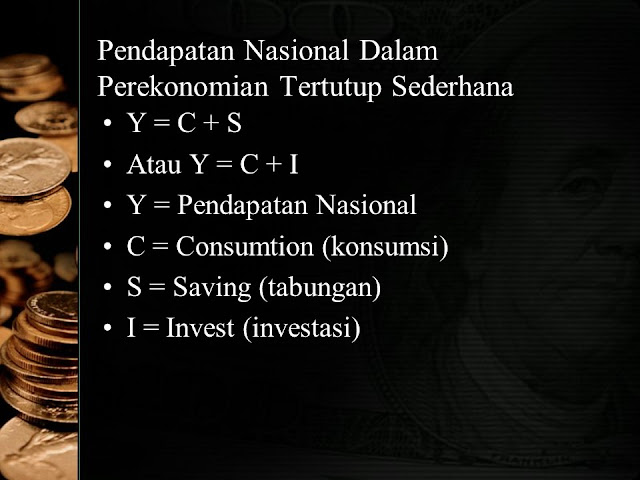
PENDAPATAN NASIONAL DALAM PEREKONOMIAN TERTUTUP SEDERHANA

Gambar

PDB (HARGA BERLAKU VS HARGA KONSTAN)

Gambar

METODE PENGHITUNGAN PENDAPATAN NASIONAL

Gambar

TIGA PASAR UTAMA

Gambar

Soal Essay Olimpiade 2

1. The following table shows Indonesian gross domestic products (in billion rupiahs) during the period of 2000-2004. Observe the data accurately and then answer the questions below the table! Year GDP at Current Market Prices GDP at the Year-2000 Constant Prices 2000 368.440 353.773 2001 428.341 357.460 2002 485.452 374.902 2003 512.560 392.641 2004 600.010 418.770 Source: Badan Pusat Statistik Compute the economic growths in the year 2001 (from 2000 to 2001), 2002, 2003, and 2004! Estimates inflation rates in the year 2001, 2002, 2003, and 2004! Make a comment or conclusion whether our economy was getting better or worse during that period! 2.    Apakah manfaat pasar modal bagi perekonomian Indonesia? 3.    Jelaskan perbedaan saham dan obligasi Tujuan dan tugas Bank Indonesia seba

Soal Essay Olimpiade 1

Kerjakan dengan singkat dan jelas soal di bawah ini! Ibu Anita membeli beberapa unit Reksa Dana sebagai sarana berinvestasi. Ketika ia membeli unit, harga per unit penyertaan adalah Rp 1.000,- sembilan bulan yang lalu. Saat ini nilai aktiva bersih per unit adalah sebesar Rp 1.560,- Ia bermaksud mengambil untung dari selisih Nilai Aktiva Bersih tersebut. Lembaga apa yang dihubungi Ibu Anita? Dan apa istilah untuk pencairan Reksa Dana? 2.     The following table presents several macroeconomic data on the Indonesian economy in the period 2002—2006. The figures are cited from “Laporan Perekonomian Indonesia 2006” published by Bank Indonesia. 2002 2003 2004 2005 2006 GDP at Current Prices (US$ billion) 198.93 237.33 256.68 289.48 369.28 Inflation Rate  (percent) 10.1 5.1 6.4